In the animation below, we fix the values for the radial and azimuthal veloticies, $v_{R}$ and $v_{\phi}$ respectively. The top left panel shows how $Z_{max}$ increases linearly with $v_z$. But, the trend is not smooth and there are “jumps” in $Z_{max}$ for a few values of $v_z$. The bottom panels show the orbit shape for a given value, represented by the blue circle, in the $v_z$-$Z_{max}$ plane. We can see that for each “jump” there is a change in the orbital family. This causes the wedges observed in the Apocentre-$Z_{max}$ plane mentioned in Hayood+18 and explained in Amarante+20a.
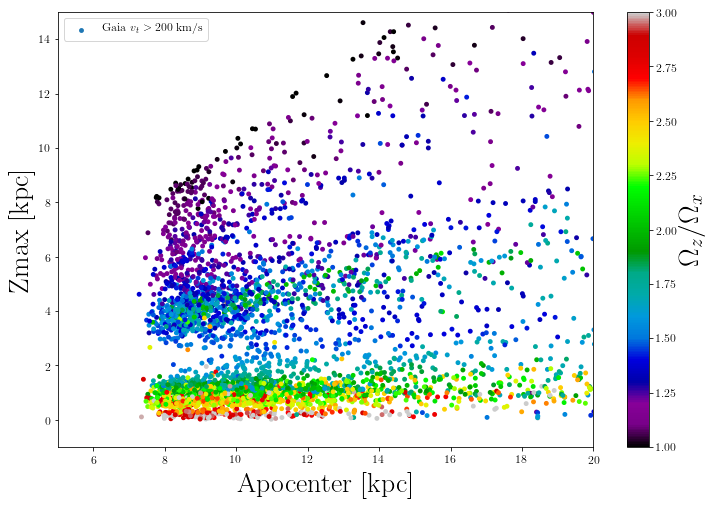
Adding to Amarante+20a, we can test the pattern seen in Apocentre-$Z_{max}$ for a different potential. This time, we calculated the orbits using Agama package and we adopted the McMillan 2017 potential. Moreover, we calculated the fundamental frequencies of the orbits using the superfreq package. Each star orbit can be represented by a fundamental frequency which is associated with a particular orbital family. In the figure below, we show the Apocentre-$Z_{max}$ plane colour-coded by the fundamental frequency ratio in the projected X and Z cartesian coordinates. It is clear that each region corresponds to a different orbital family, dinstiguished by their frequency ratio. Surprisingly, the ratio does not decrease monotonically towards higher z. This effect can be due to the instability of the resonances regions.